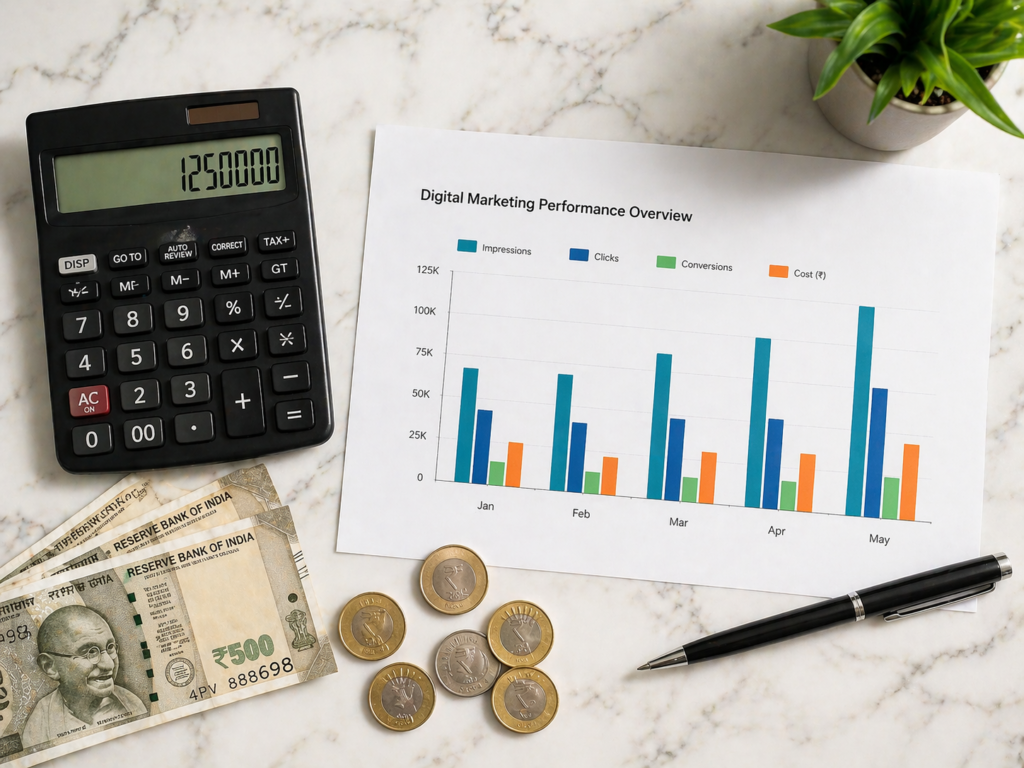
If you’re spending money on Meta, or Google Ads and not tracking ROAS, you’re flying blind. You might be getting leads, seeing impressions go up, and feeling like ads are “working” — but without ROAS, you have no idea whether you’re making money or burning it. This guide explains exactly what ROAS means, how to calculate it with Indian examples, and what a healthy ROAS looks like for your specific industry.
ROAS Meaning — In Simple Terms
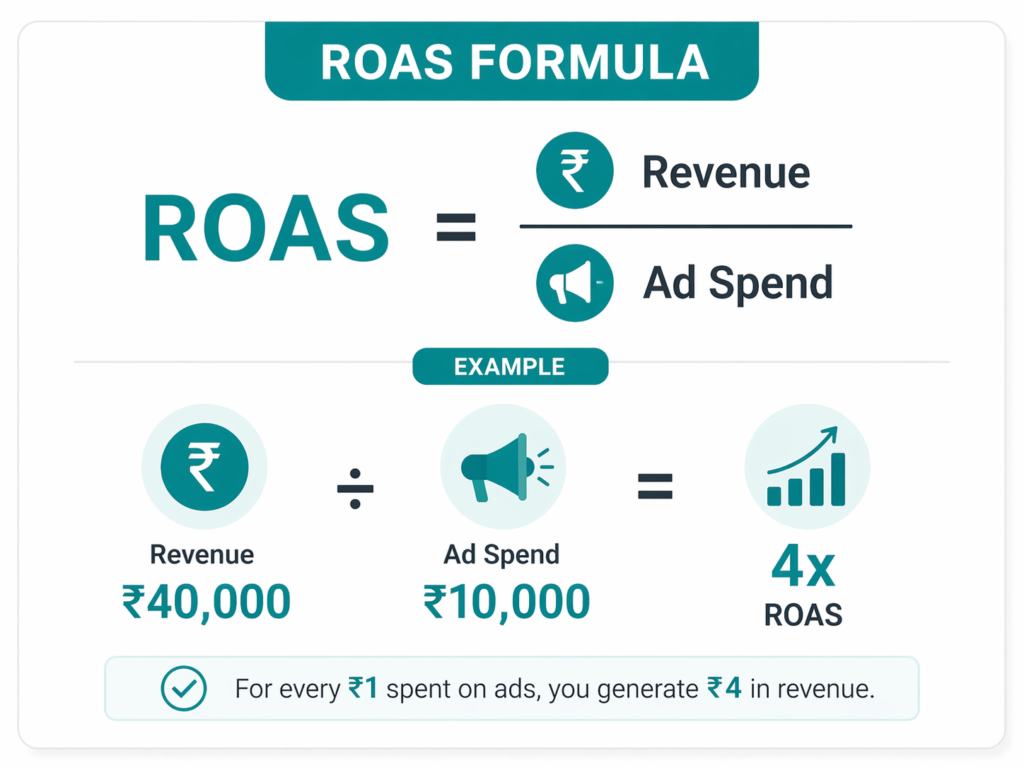
ROAS stands for Return on Ad Spend. It tells you how much revenue you earned for every rupee you spent on advertising. The formula is simple:
If you spent ₹10,000 on Facebook Ads and generated ₹40,000 in sales directly from those ads, your ROAS is 4x (or 4:1). That means for every ₹1 you put in, you got ₹4 back
ROAS is expressed as a multiplier (3x, 5x, 10x) or a ratio (3:1). A ROAS of 1x means you broke even. Below 1x means you’re losing money. The higher the ROAS, the more profitable your campaigns.
ROAS vs ROI — What’s the Difference?
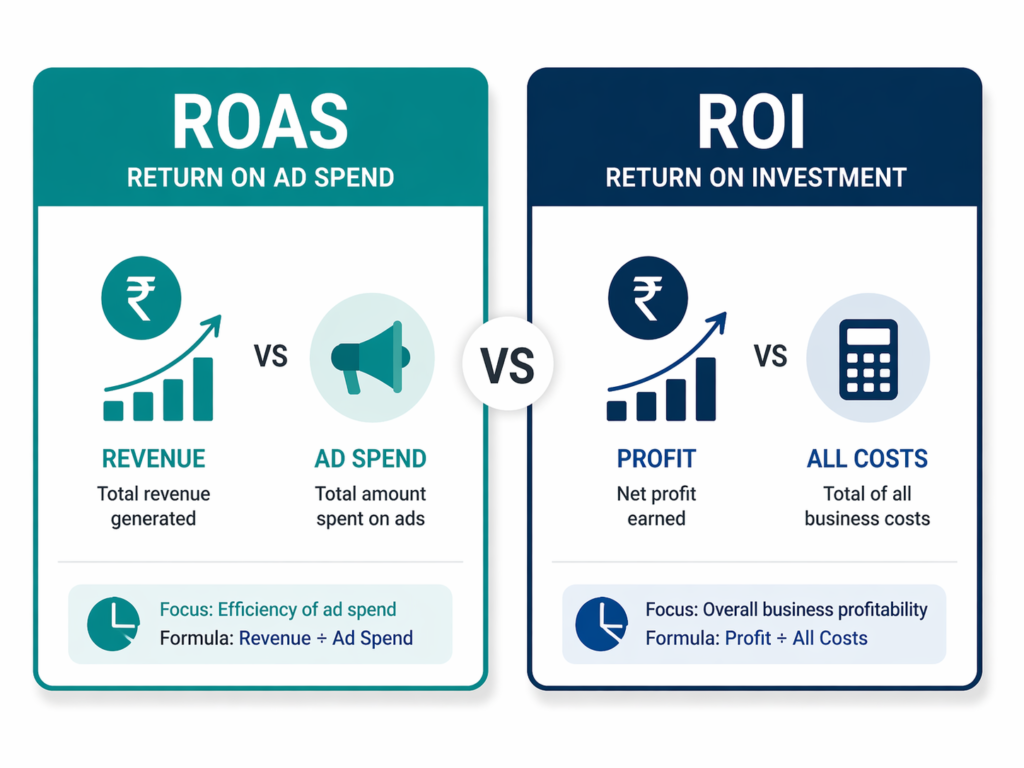
These two metrics confuse a lot of business owners. Here’s the key distinction:
- ROAS only measures revenue vs ad spend. It doesn’t factor in product cost, delivery, team salaries, or overheads.
- ROI (Return on Investment) is broader — it factors in ALL costs (including ad spend) against net profit.
Example:
You run ads for ₹10,000. You generate ₹40,000 in revenue. Your ROAS is 4x — looks great!
But if your product costs ₹25,000 to produce and deliver, your actual profit is only ₹5,000 on a ₹10,000 ad spend. Your ROI is actually negative once you factor in other overheads.
Use ROAS to measure your ad platform performance. Use ROI to measure overall business profitability. Both matter — but most ad platforms report ROAS, so that’s where you’ll start.
How to Calculate ROAS
Formula and Worked Example
Example 1 — Real Estate:
A Lucknow-based builder spends ₹50,000/month on Meta Ads. The ads generate 80 leads, out of which 2 convert into flat bookings at ₹75 lakhs each. Revenue attributable to ads = ₹1.5 crore. ROAS = 1,50,00,000 ÷ 50,000 = 300x. (Real estate naturally has massive ROAS figures because ticket sizes are huge.)
Example 2 — Local Services:
A digital marketing agency in Delhi spends ₹15,000 on ads. They acquire 3 new clients paying ₹20,000/month each. Monthly revenue from those clients = ₹60,000. ROAS = 60,000 ÷ 15,000 = 4x.
Example 3 — E-commerce:
A fashion brand spends ₹20,000 on Instagram ads and generates ₹55,000 in direct sales tracked via pixel. ROAS = 55,000 ÷ 20,000 = 2.75x. After product costs, margins may be thin — which is why knowing your break-even ROAS matters (covered next).
What is a Good ROAS for Businesses?
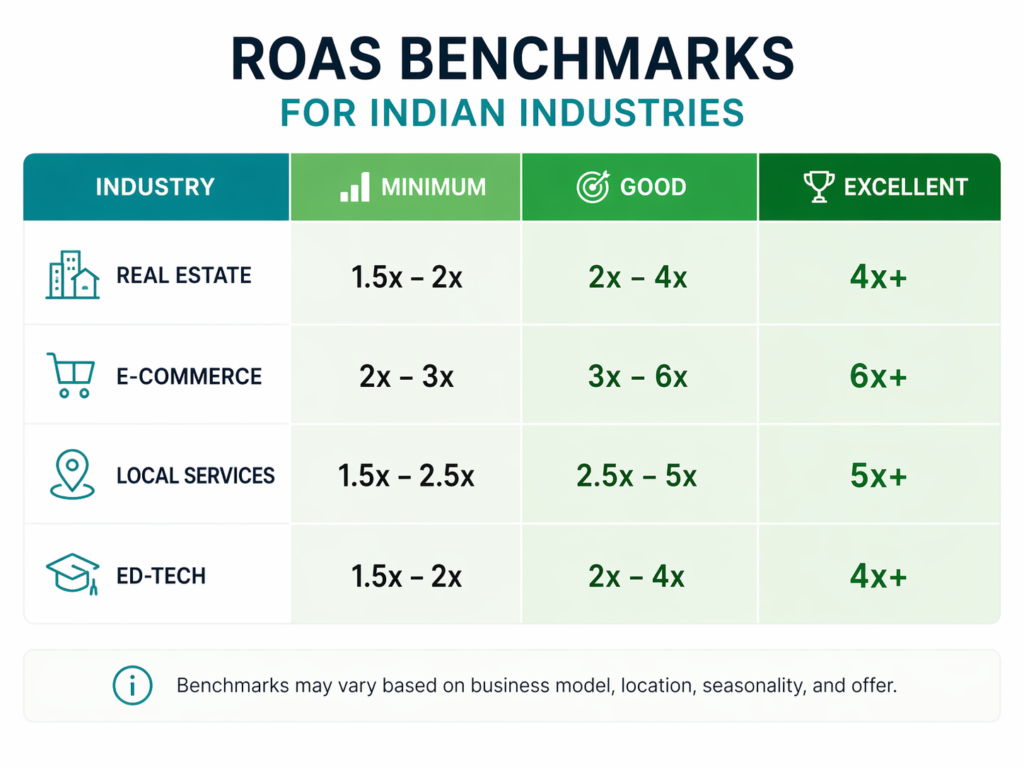
There’s no universal “Good ROAS” — it depends entirely on your industry, margins, and business model. Here’s a practical benchmark guide
Industry Benchmarks: Real Estate, E-commerce, Local Services
Your break-even ROAS is calculated as:
How to Improve Your ROAS on Meta Ads
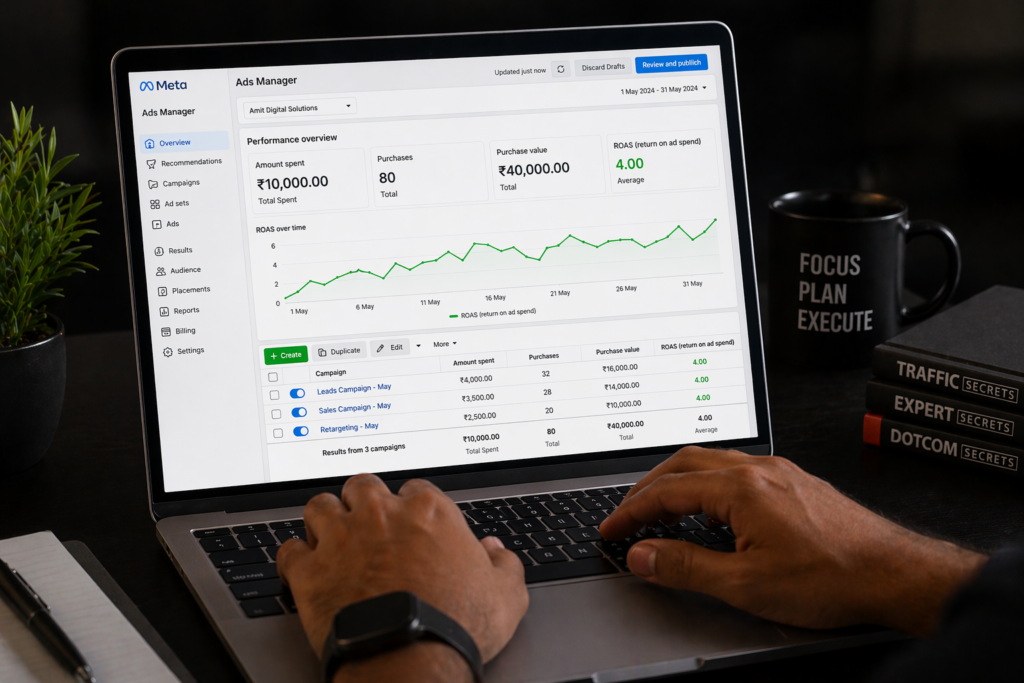
Poor ROAS is almost always a symptom, not the disease. Here are the two highest-leverage fixes:
Fix Your Landing Page First
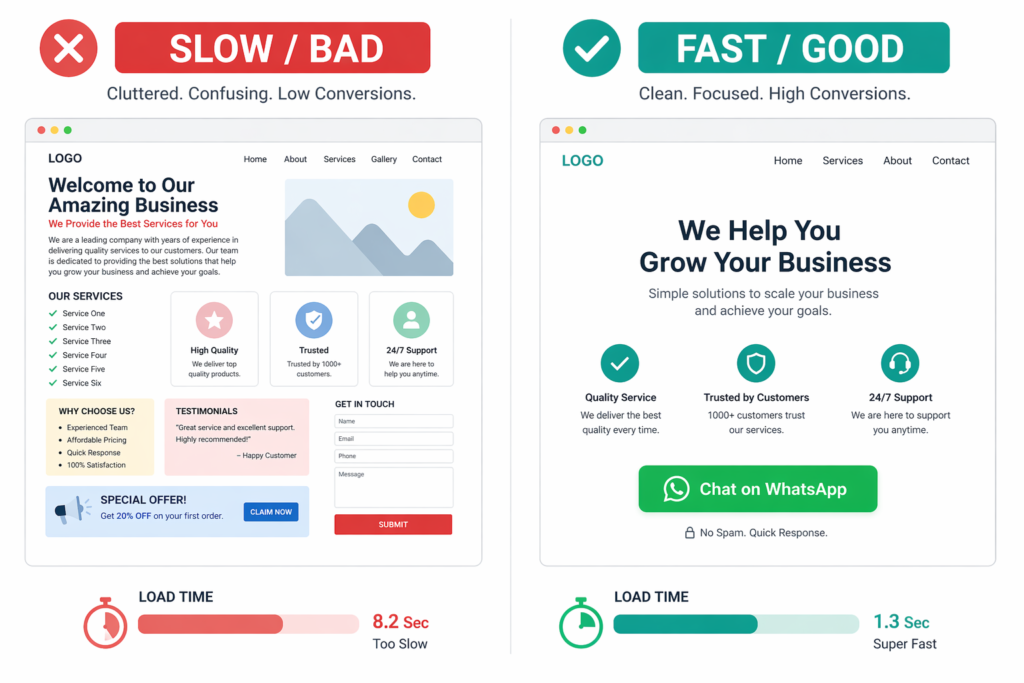
Most ROAS problems don’t start in Ads Manager — they start on your landing page. You could have the best ad in the world, but if people land on a slow, confusing, or untrustworthy page, they leave without converting.
For Indian audiences specifically:
- Load time under 3 seconds on mobile (test on Jio 4G network conditions)
- WhatsApp CTA above the fold — Indian buyers trust WhatsApp more than forms
- Show price ranges — hiding pricing creates friction and attracts wrong-fit leads
- Add social proof — testimonials, number of clients served, Google ratings
A single landing page improvement can increase your conversion rate from 2% to 5%, which triples your ROAS without changing a single rupee of ad spend
Audience Narrowing Tactics
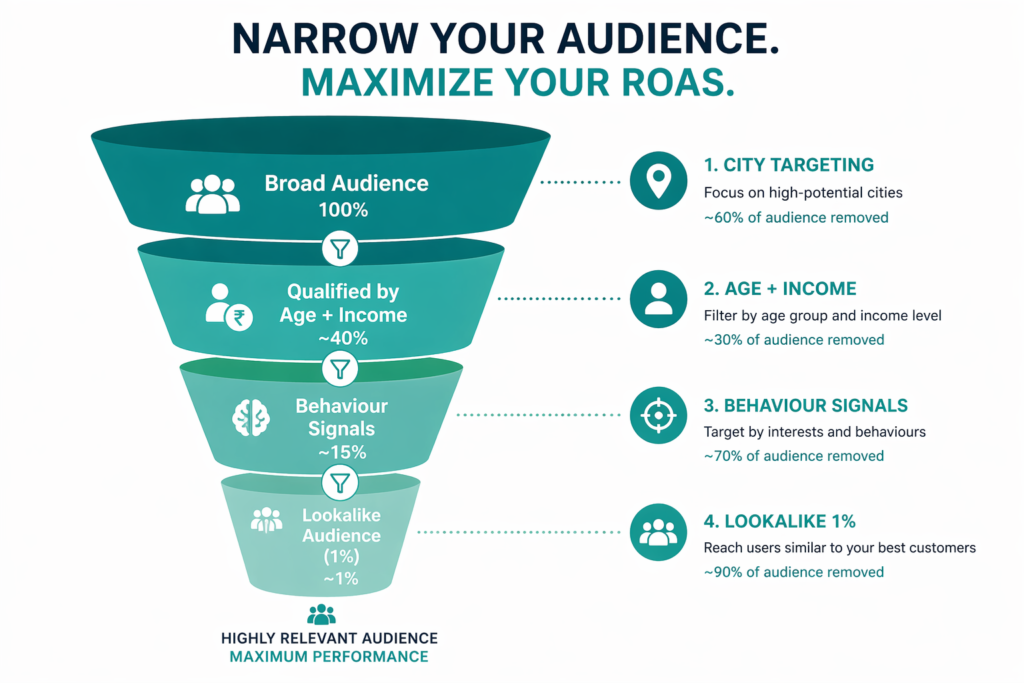
Paradoxically, spending less money on a smaller, better-targeted audience often yields higher ROAS than blasting a large audience. Try these:
- Lookalike Audiences (1–3%) based on your existing buyers or website visitors — Meta finds people who statistically behave like your best customers
- Exclude recent leads from lead gen campaigns to avoid wasting spend on people already in your pipeline
- Layer income/behaviour signals — for premium products, combine city targeting with Meta’s “High Income Households” or “Frequent Travellers” behaviour filters
- Custom Audiences from WhatsApp — upload your existing lead list to Meta and create a lookalike from your actual warm database
Tools to Track ROAS Automatically
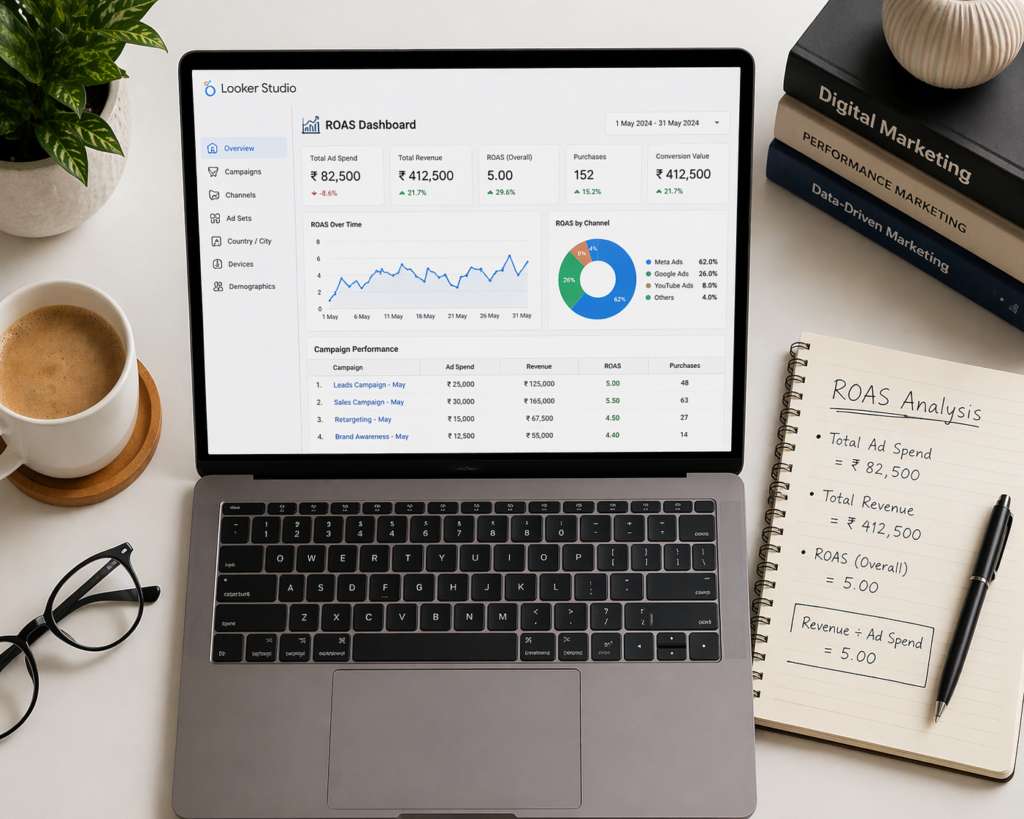
Manual ROAS calculation works, but automation saves hours every week and catches problems faster:
- Meta Ads Manager (built-in): Shows ROAS directly in your columns if you have the Conversions API or Pixel set up correctly with purchase events
- Google Looker Studio (free): Connect your Meta Ads and Google Analytics data into one dashboard with ROAS visualised automatically
- Zoho Analytics / Supermetrics: Paid tools that pull ad spend and revenue into clean reports — worth it once you’re spending ₹1 lakh+/month
- Simple Google Sheet tracker: For budgets under ₹50,000/month, a weekly ROAS tracker in Sheets is perfectly effective — log spend and revenue by campaign every Monday
The key is consistency. Review ROAS weekly, not daily (too much noise daily). Make budget reallocation decisions monthly based on 30-day trends, not 3-day fluctuations.